here is the code
def rgb_to_XYZ(r, g, b):
ref = 0.17697
r /= 255.0
g /= 255.0
b /= 255.0
x = (r*0.49 + g*0.31 + b*0.2 ) / ref
y = (r*ref + g*0.8124 + b*0.01063) / ref
z = (r*0.0 + g*0.01 + b*0.99 ) / ref
return x,y,z
def XYZ_to_rgb(X, Y, Z):
r = X * 0.41847 - Y * 0.15866 - Z * 0.082835
g = -X * 0.091169 + Y * 0.25243 + Z * 0.015708
b = X * 0.00092090 - Y * 0.0025498 + Z * 0.17860
r = int(r*255+0.5)
g = int(g*255+0.5)
b = int(b*255+0.5)
return r,g,b
# un utilitaire pour vérifier si le rgb est bien valide (pas tjrs le cas!)
def inside(mini,x,maxi):
return (mini<=x) and (x<=maxi)
def valid_rgb(r,g,b):
return inside(0,r,255) and inside(0,g,255) and inside(0,b,255)
d = 6.0/29.0
d3 = d*d*d
d2 = d*d
y0 = 4.0/29.0
# un blanc de reference est necessaire pour les calculs CIE
r = 5.650675255693056/100 # necessaire pour convertir l'illuminant Y=100 dans le meme range que XYZ
D65 = (95.047*r,100.0*r,108.883*r)
Xn,Yn,Zn = D65
def _forward(t):
if t > d3:
y = pow(t,1.0/3.0)
else:
y = t/3.0/d2 + y0
return y
def _inverse(t):
if t > d:
y = t*t*t
else:
y = 3*d2*(t-y0)
return y
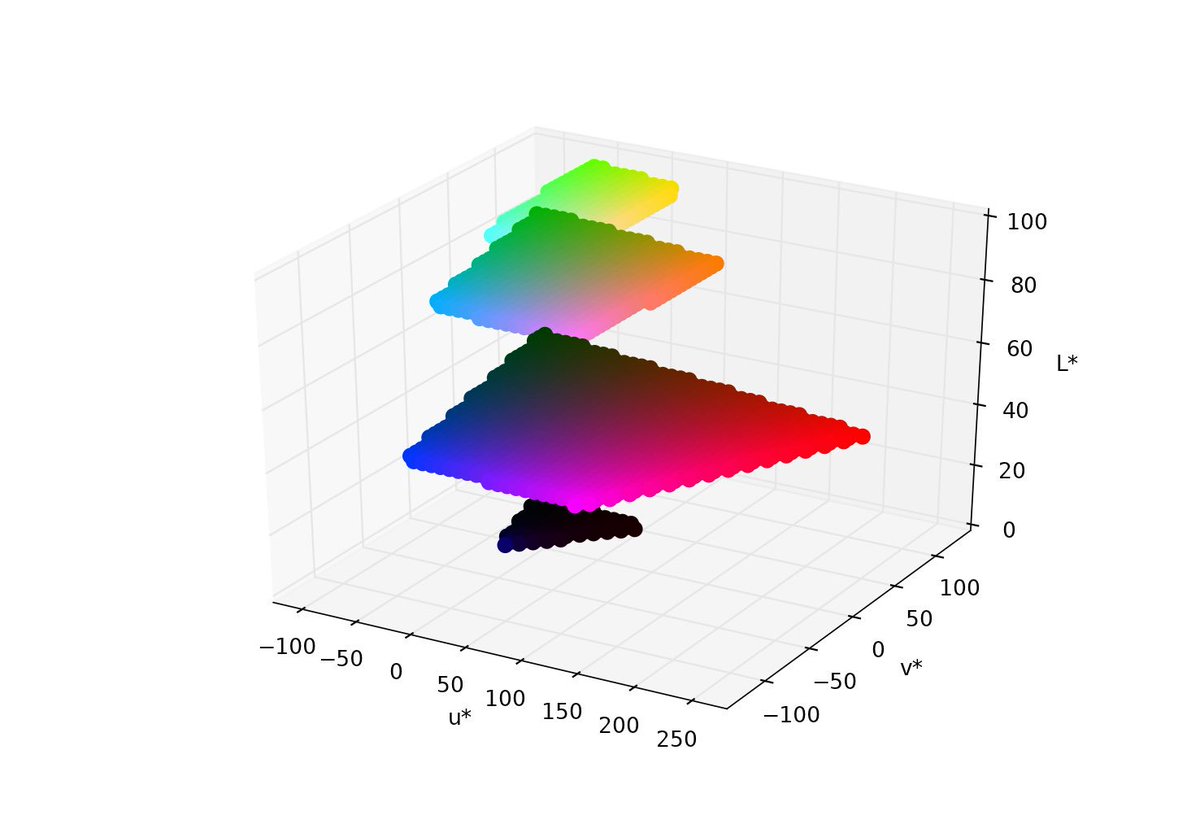
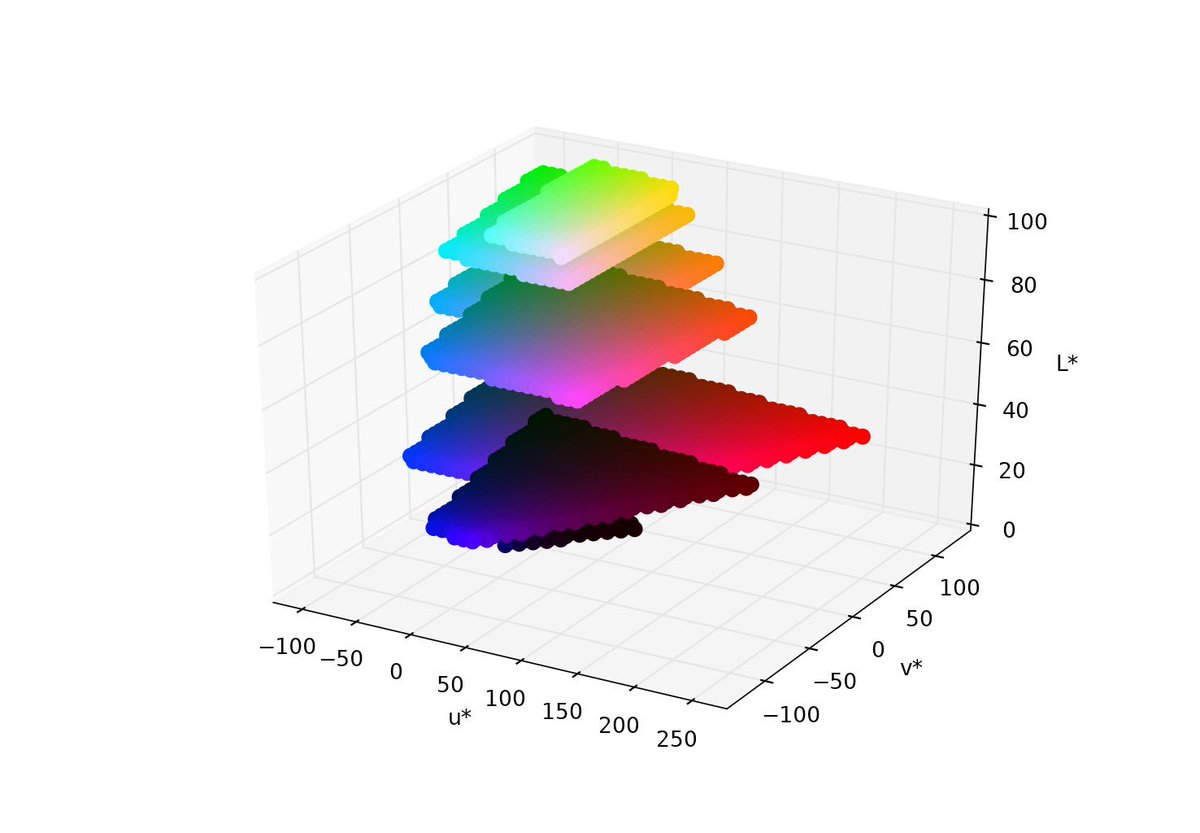
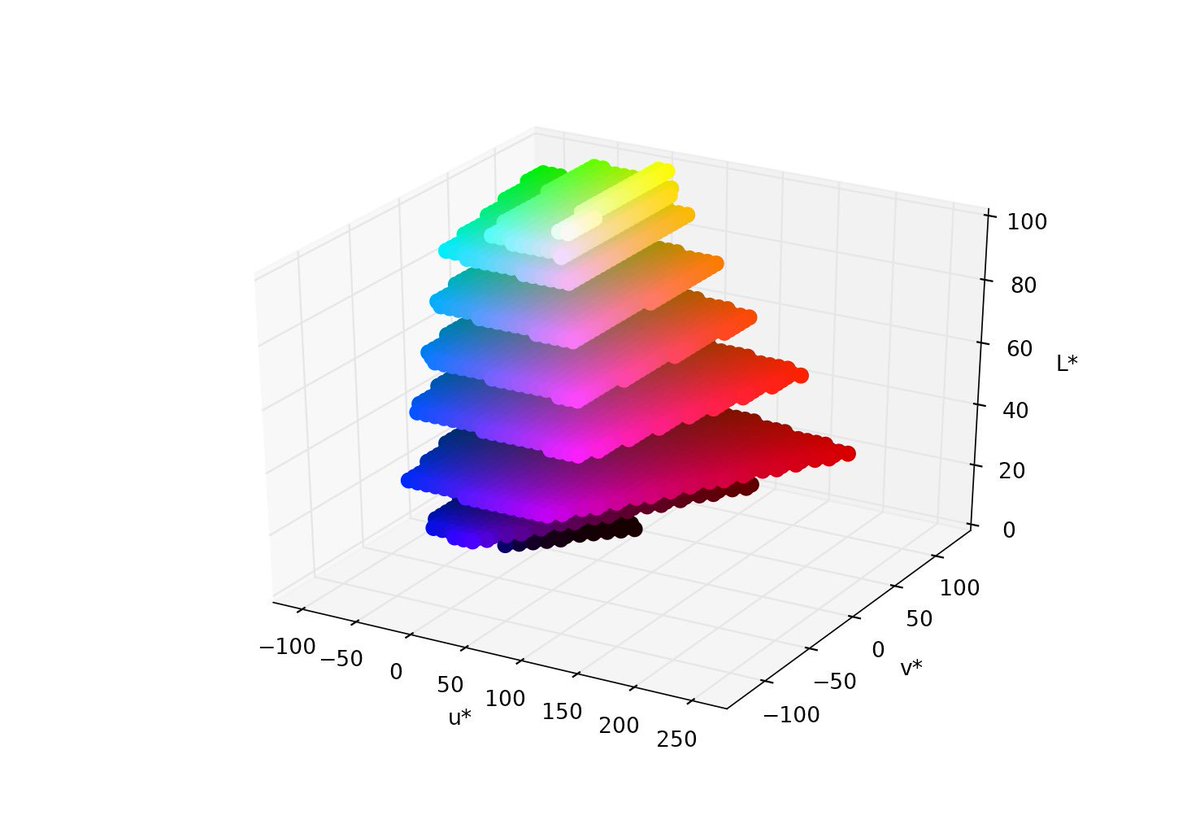
# le systeme L*,u*,v* que j'appelle 'sLuv' comme 'star Luv'
# dans ce systeme, la distance euclidienne entre couleurs est a peu pres conforme à la JND de l'oeil
Un = 4*Xn/(Xn+15*Yn+3*Zn)
Vn = 9*Yn/(Xn+15*Yn+3*Zn)
def XYZ_to_sLuv(X, Y, Z):
L = 116*_forward(Y/Yn) - 16
s = (X+15*Y+3*Z)
if s==0 :
return 0.,0.,0.
Up = 4*X/s
Vp = 9*Y/s
u = 13*L*(Up-Un)
v = 13*L*(Vp-Vn)
L,u,v = round(L,3),round(u,3),round(v,3)
return L,u,v
def rgb_to_sLuv(r,g,b):
X,Y,Z = rgb_to_XYZ(r,g,b)
return XYZ_to_sLuv(X, Y, Z)
def sLuv_to_XYZ(L,u,v):
if L==0 :
return 0.,0.,0.
Y = Yn * _inverse((L+16)/116)
Up = u/13/L + Un
Vp = v/13/L + Vn
x = 9*Up/(6*Up-16*Vp+12)
y = 4*Vp/(6*Up-16*Vp+12)
X = x*Y/y
Z = (1-x-y)*Y/y
return X,Y,Z
def sLuv_to_rgb(L,u,v):
X,Y,Z = sLuv_to_XYZ(L,u,v)
return XYZ_to_rgb(X, Y, Z)
def get_sLuv_limits():
Lmin,Umin,Vmin = rgb_to_sLuv(0,0,0)
Lmax,Umax,Vmax = Lmin,Umin,Vmin
for r in [0,255]:
for g in [0,255]:
for b in [0,255]:
L,u,v = rgb_to_sLuv(r,g,b)
Lmin,Umin,Vmin = min(Lmin,L),min(Umin,u),min(Vmin,v)
Lmax,Umax,Vmax = max(Lmax,L),max(Umax,u),max(Vmax,v)
return Lmin,Umin,Vmin,Lmax,Umax,Vmax
def get_limits(toLuv):
Lmin,Umin,Vmin = toLuv(0,0,0)
Lmax,Umax,Vmax = Lmin,Umin,Vmin
for r in [0,255]:
for g in [0,255]:
for b in [0,255]:
L,u,v = rgb_to_sLuv(r,g,b)
Lmin,Umin,Vmin = min(Lmin,L),min(Umin,u),min(Vmin,v)
Lmax,Umax,Vmax = max(Lmax,L),max(Umax,u),max(Vmax,v)
return Lmin,Umin,Vmin,Lmax,Umax,Vmax
from numpy import linspace
def getPoints(zz,toLuv,toRGB,x,y,z,c):
Lmin,Umin,Vmin,Lmax,Umax,Vmax = get_limits(toLuv)
L = Lmin + zz*(Lmax-Lmin)
for vv in linspace(0.0,1.0,num=50):
v = Vmax - (Vmax-Vmin)*vv
for uu in linspace(0.0,1.0,num=50):
u = Umin + (Umax-Umin)*uu
#print(u,v)
r,g,b = toRGB(L,u,v)
if valid_rgb(r,g,b):
x.append(u)
y.append(v)
z.append(L)
c.append((r/255,g/255,b/255))
#print(u,v,L,)
return True
def show3d(toLuv,toRGB):
Lmin,Umin,Vmin,Lmax,Umax,Vmax = get_limits(toLuv)
Lmin,Umin,Vmin,Lmax,Umax,Vmax = round(Lmin),round(Umin),round(Vmin),round(Lmax),round(Umax),round(Vmax)
from mpl_toolkits.mplot3d import Axes3D
import matplotlib.pyplot as plt
fig = plt.figure()
ax = fig.add_subplot(111, projection='3d')
ax.set_xlabel('u*')
ax.set_xlim([Umin,Umax])
ax.set_ylabel('v*')
ax.set_ylim([Vmin,Vmax])
ax.set_zlabel('L*')
ax.set_zlim([Lmin,Lmax])
x,y,z,c = [],[],[],[]
for zz in {0.1, 0.3, 0.5, 0.7, 0.8, 0.9, 0.95 }:
#x,y,z,c = getSurface(zz,toLuv,toRGB)
getPoints(zz,toLuv,toRGB,x,y,z,c)
ax.scatter(x, y, z, s=80, color=c, marker='o', alpha=1.0, linewidth=0)
plt.show()
fig.savefig('test.png')
plt.close(fig)
if __name__ == '__main__':
import console as cs
cs.clear()
show3d(rgb_to_sLuv,sLuv_to_rgb)