What would be de Phytonista script code to read a binary file stored in the App sandbox into a 2D float point array for further processing. I've tried so far many sample codes from other Python forums unsuccessfully.
Forum Archive
Binary files read and write
To open files in binary mode (instead of text mode, which is the default), use the "rb" (read) and "wb" (write) modes. To convert the floating-point data to Python's float type, have a look at the struct module. Make sure to explicitly set the byte order to what is used in your file, otherwise the resulting data might be bogus.
For the "further processing" part, you might find the numpy module useful. I haven't used it much myself - it's possible that it also provides ways of reading C-style arrays from a bytestring or a file.
EDIT: https://github.com/cclauss/SPLnFFT_tools contains the code created based on this thread. Please open issues and/or submit pull requests to improve that code.
I created read() and write() with the array module and again with the struct module. It seems like much more work than just reading and writing json files which are far more portable and remove all the machine-specific abnormalities. https://github.com/cclauss/SPLnFFT_tools/blob/master/old_code/binary_file_of_2d_matrix.py
Thanks to CCC for this valuable piece of code which teaches a lot about dealing with binary data imported from other Apps. In my case, it is raw float data of SPL measurements organized in two columns for both Slow and Fast time weightings that were imported from Dropbox with a script available in this Forum. I wonder why 2D or nD arrays have to be dealt as structures in Python.
I'll test it and will report the results. Thanks again
ManuelU
Which SPL are we talking about? https://en.wikipedia.org/wiki/SPL ?
EDIT: SPL stands for Sound Pressure Level. The binary files in question are generated by the iOS apps SPLnFFT and SPLnWatch with a required in-app purchase.
The sample script works fine and now I understand the process. Just a further question: For reading only my binary file with floating point data, like 'MYSPLDATA.BIN' how should I define the 2D array? , and do I need to initialize it with some value, as in the sample script?.
What is SPL? What kind of computer writes the SPL datafile? What program on that computer writes the SPL datafile? Is there any documentation on the SPL format? Is there a sample SPL file with know values?
I would start with:
print(read_floats_via_array('MYSPLDATA.BIN'))
And see if the values look good.
The App is SPLnFFT for iOS. Your script works fine in Array mode with the only exception of this instruction: floats_in_the_file = os.path.getsize(filename) / struct.calcsize('f')
I just noticed that you changed the source code of the script. Now it reads 5MB binary data in about 4 seconds using the Array Mode. I'll check the Structure Mode and report results. Congratulations
How can I access the data in the 2D array to make plots and numeric calculation of aggregated data?. The App saves 5MB data for a 24 hours recording. If the recording time is shorter it pads data with zeroes. Is there a way to filter out this values while reading the file?. The total data saved in float format is computed as follows: count=2436008*2;
There was an error count=24 * 3600 * 8 * 2; Sorry
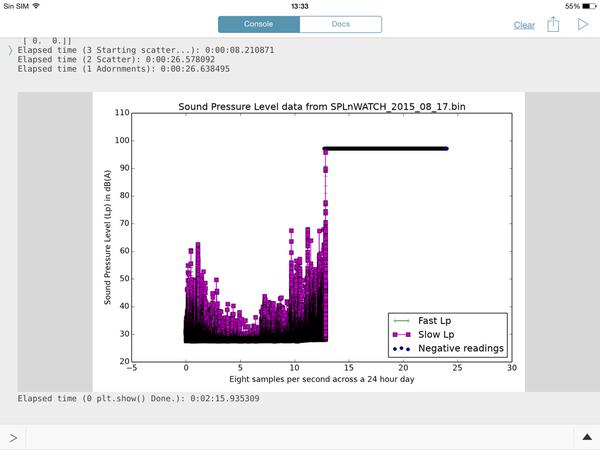
Here is a short sample of the values read by your script in Array Mode. Observe the zero values at the end.
(50.56001281738281, 53.25138854980469), (51.46320724487305, 59.16133117675781), (53.85163116455078, 56.33137512207031), (54.70978546142578, 54.6609001159668), (55.20241165161133, 47.02310562133789), (55.262977600097656, 40.11175537109375), (54.45186996459961, 43.808773040771484), (54.05076217651367, 42.50151824951172), (53.665225982666016, 54.5957145690918), (53.8406867980957, 65.96211242675781), (58.009944915771484, 65.0105972290039), (59.889801025390625, 59.607154846191406), (60.222530364990234, 56.390960693359375), (60.41679763793945, 54.57362747192383), (60.55101776123047, 41.55317687988281), (60.54636001586914, 40.97874450683594), (60.54383850097656, 46.896514892578125), (60.42774200439453, 45.11729049682617), (57.88348388671875, 49.7500114440918), (53.61359786987305, 46.01418685913086), (50.81377410888672, 36.51190185546875), (48.24237823486328, 31.083229064941406), (44.919986724853516, 32.971107482910156), (44.69907760620117, 46.87627410888672), (45.31845474243164, 39.48908233642578), (44.62737274169922, 35.4039192199707), (44.04755401611328, 34.72141647338867), (41.45051956176758, 34.2315673828125), (39.6866569519043, 33.11891174316406), (39.542598724365234, 50.92300796508789), (43.85606002807617, 34.235633850097656), (43.871002197265625, 40.384735107421875), (42.935977935791016, 52.999149322509766), (46.3834228515625, 52.6627311706543), (48.203895568847656, 57.949790954589844), (51.57520294189453, 52.208770751953125), (52.15311050415039, 45.712528228759766), (52.26800537109375, 50.851497650146484), (52.261497497558594, 46.12493133544922), (52.383358001708984, 84.88561248779297), (0.0, 0.0), (0.0, 0.0), (0.0, 0.0), (0.0, 0.0), (0.0, 0.0), (0.0, 0.0), (0.0, 0.0), (0.0, 0.0), (0.0, 0.0), (0.0, 0.0), (0.0, 0.0), (0.0, 0.0), (0.0, 0.0), (0.0, 0.0), (0.0, 0.0), (0.0, 0.0)
How can I access the data in the 2D array to make plots and numeric calculation of aggregated data?
I am unclear what you mean. Your last post looks to me like it is a list of (x, y) tuples. What else do you need?
To remove all (0.0,0.0) elements from your list...
my_list = [(x[0], x[1]) for x in my_list if x[0] and x[1]] # remove all (0.0,0.0) elements
count=24 * 3600 * 8 * 2
count = 24 (hours in a day) * 60 (minutes in an hour) * 60 (seconds in a minute) * 8 (what is this? (samples per second?)) * 2 (values (fast and slow?))
Thera are two weighting times for SPL meters : SLOW = 0ne reading per second; FAST = one reading every 1/8 of second. That means that you have a pair of eight data points every second. One minute has 60 seconds so you have 60 * 60 = 3600 seconds per hour. One hour has 3600 * 8 * 2 = 57600 data points in float format that are exported to Dropbox. Another problem are the NAN AND infinite values generated for many reasons, that have to be replaced by the previous SLOW or FAST recorded values. They are mostly negative values. As you can observe, there is a post processing job to be done before plotting or computing aggregated data to render reliable results.
The total size of any file exported to Dropbox by the App SPLnFFT Noise Meter is 5529600 Bytes, therefore each data point in float format uses 4 Bytes. (24 * 3600 * 8 * 2 = 1382400) * 4 = 5529600. I've observed that The instruction: floats_in_the_file = os.path.getsize(filename) / struct.calcsize('f') reads a lot of garbage where is supposed to read zeroes.
Do the array approach and struct approach generate the same list?
What is printed if you add print(floats_in_the_file) when you run the script against a 5529600 byte file? I would expect 1382400.
You could try removing bogus values by post-processing the list with:
my_list = [(x[0], x[1]) for x in my_list if x[0] > 0 and x[1] > 0] # remove invalid elements
You are right, the maximum number of data points in the binary file is 1382400. I'm new in Phytonista and I'll have to read how to detect and remove NaN an Infinite values in Phyton and what are the available Array functions. I've an Academic Apple Developer License and I'm exploring all the available options to process the noise data within the IOS environment with an Universal standalone App. As far as I know, Phytonista seems to be the only one to import SPL data with a script from the Dropbox to its sandbox, overriding the cumbersome iTunes File Sharing. The project is part of an epidemiological investigation on Environmental Noise and Health which includes, among other challenges, the simultaneous recording of an ECG.
Thanks for your valuable help.
OK... In just over 1 second SPLnFFT_Reader.py reads 1,382,400 floats out of the binary file, converts that into a 2d list of 691,200 fast_slow pairs and cleans that down to a 2d list of 2,786 valid fast_slow pairs and prints out the first 50 pairs.
My cleansing step might not be right for your purposes. You can use math.isnan() and math.isinf() to find those values but I do not believe that it is required anymore because the author of the SPLnFFT app told me in an email that "In the matlab [example] script there is some processing to get rid of NaN data. But I thought I had solved this in latest release of SPLnFFT".
Calling all numpy gurus... Why does this not work as expected?
import numpy
data = numpy.fromfile('SPLnFFT_2015_07_21.bin', dtype=float)
print(len(data)) # 691200 :-( this is half of the expected number
You can try this:
data = numpy.fromfile('SPLnFFT_2015_07_21.bin', dtype=numpy.dtype('f4'))
The Python float data type is usually implemented as a double (8 bytes), so this specifies the number of bytes explicitly.
Do issues still exist with byte order on different platforms? I really don't know. A long time ago, we used to have to consider this. Big and little Indien when reading binary/memory files without an API that took care of the translation
Yes. Complexity is preserved but it is better hidden. The fortunate thing here is that the file in question was written out by one iOS app (SPLnFFT) and read in by another iOS app (Pythonista) so byte order is not an issue.
@ccc. Ok, understand. Honestly, was not even sure these issues still existed. Regardless, normally they have no impact as long as you are calling API calls, it's when we decide to get tricky and implement our functions/ methods for reading so called cross platform files. But in this environment, I think it's food for thought. But as you say in the case, both files written from iOS so not a problem
Now I understand why numpy is all the rage with data scientists!!!
3 lines of numpy do the whole thing!! Import, read, transform, and cleanse. Much faster execution time too.
import numpy
data = numpy.fromfile('SPLnFFT_2015_07_21.bin', dtype=numpy.float32).reshape(-1, 2)
data = data[numpy.all(data > 0, axis=1)] # cleanse
print(type(data), len(data)) # numpy.ndarray, 2786
print(data[:20]) # print first 20 fast, slow pairs
Hi CCC. I tried your script with an edited version of a SPLnFFT binary files before the iOS two last updates. Last night I made some random noise mesurements. For my surprise the exported files had many chunks of zeroes alternating with random chunks of normal SPL values. That is not a mormal behavior. No NaN or Infinite values were detected this time. If you give me a mail address I can send you the link to some test files in my Dropbox account. The struct approach and the array approach render the same results. You JUST gave another present to SPLnFFT users with your SPLnFFT_Reader.py. I'll download and try it right away. Best Regards
Use the numpy version instead. It is simpler, faster, and easier to mess around with. If you have a computer with an iPython notebook, that would be a great environment for exploring the dataset.
To send a Dropbox file, you can check it directly into the Github repo above via a pull request or you can go into your Dropbox client and tap once on the file to select it and then tap the share icon (a box with an arrow pointing up out of it) and share as email. Cut the URL out of that draft email, and paste it into a comment on the repo or here.
does the splnfft guy have matlab scripts that read and plot the data? the screenshots show such an .m file. if younhave a copy of that, it would explain how to parse and interpret the data.
Yes, it has a Matlab script that you can use with Octave, with no changes. There is also available an Excel Macro that allows you to process the whole file with one hour chunks. What is for me an attractive feature of Phytonista is the possibility to importe the SPLnFFT bin files or any other file type directly from the Dropbox to the sandbox. You don't need a desktop computer and overrides the cumbersome process of iTunes file Sharing. The SPLnFFT is linked to another App of the same author: SPLnWATCH, that can record in the background, an excellent battery and screen saver option.
can you post a link to the matlab script?
Is Octave this app http://octilab.com ? How did you get the .bin file into that app?
You can get it at the SPLnFFT Noise Neter Developer Web Page. He currently uses a Face book account. If he sent you an email, I think you make ask him a copy and he will happy to send it t you. You have to use it in a desktop computer because the online iOS Apss Octalib and Octave pro don't have File I/O support. I now nothing about copyright, but as a user I have a copy stored in my Dropbox account. It's in fact a Matlap script but works in Octave. Of the scripts available, I just used the Excel Macro. You need Microsoft Office 10 or above. I had it installed in a PC with windows XP Pro but they stopped the OS support some months ago. With the excellent scripts you supplied and my IPad Air 2, I don't need it at all to import and process the binar Data. I have also an iOS Basic interpreter with a powerful graphic class that has an option to compile the source code wit XCode. I'm still struggling with the Python code to plot the imported data with your Phytonista scripts. By the way, can Phytonista scripts be compiled with Apple's Xcode?. I use it with a Mac Mini. I'll do anything needed to avoid the iTunes file sharing in the standalone iOS App I'm developing for my Noise project.
There is an XCode template that allows you to compile your Pythonista scripts into standalone iOS apps that you can put into the Apple AppStore.
See the changes made to SPLnFFT_Reader_numpy.py. I added a matplotlib scatter chart of the data to show you the graphics capabilities of Pythonista. I could really use the help of someone who knows matplotlib to make the graphic more relevant to this dataset (x=fastFFTs, y=slowFFTs).
Thanks CCC. The only thing needed is an X_time vector, depending on the total number of data points. This plot show the correlation between SLOW and FAST values.
In the Matlab script for a 24 hour record is created as:
count=24 * 3600 8 2;
TabTime=[0:count/2-1]/(count/2)*24;
The xCode Template sounds interesting. Unfortunately I have an Academic License and you need to register all devices where the App will be used. I only have an IPad 3 and IPad Air 2, and Xcode only allows 64 bits devices, from iPad 3 and above. This issue could be solved by buying a commercial license, but my intentions are only academic.
in the matlab he also filters Inf values, and plots them in a third color with a value of 1 plus the max value in the dataset.
My sense from my emails from the author of SPLnFFT is that the newer files have NO Infs and NO NaNs. I do not find either in the files that I generate with SPLnFFT. I will verify this with the author.
If you know how to create a matplotlib plot that looks like what Matlab generates, I would be happy to accept the pull request ;-).
pull request on the way. it is not clear what defines the time scale -- does the file always contain a full 24 hours (hence the msny zeros if it wasnt run for that long)?
Before the cleansing step, each file is 8 readings per second times 24 hours.
I'm using and observing SPLnFFT since more than one year ago. If you have the App with the 24 hours export option installed, please, start a recording, pause and go to the HISTO screen. You'll see in the lower right corner a camera icon. Pulse it and next pulse the icon below the 24 HOURS option. This action exports to Photos a 24 hours plot. If you start recording again, let's say after one hour, repeat the same process and observe the differences between plots. By observing this facts repeatedly, I came to the conclusion that when you start and pause the recording, the App must save in a memory buffer the previous SPL values until a 24 hours cycle is completed. It also explains the chunks of SPL values alternating with zero values chunks if you analyze the first of the two 5.2 MB files exported, I sent you a sample in a former comment. THEREFORE, YOU MUST OMITE THE CLEANSE PART OF YOUR CODE IF YOU WANT TO OBTAIN A SIMILAR PLOT with the first Python script you released. I reported this findings to the App developer. Hope this help.
I accepted the pull request from @JonB and then added more labels so the graph now looks quite presentable. There is also a remove_zero_readings flag to easily remove the cleansing step but if you set it to False, the graph can take more than a minute to appear. Be patient, it will appear.
Hello,
I am new to coding and am going through Zed Shaw's Learning Python The Hard Way. I would like to practice the exercises using Pythonista but am a bit confused on how to proceed. In Zed's course we write the scripts in Text Wrangler then run them in the shell. Could someone point me in the right direction on how to do that but using Pythonista?
Thank you for any advice you could offer.
Mark Connors
In Pythonista, you'd obviously use the built-in editor instead of e. g. TextWrangler as you would on a computer. However Pythonista doesn't include any kind of shell. To run scripts you just use the "play" button in the toolbar.
I don't know how much the book uses the shell - if it's only used to run the Python scripts you wrote in the editor, then it shouldn't be a problem. If it's used to pass runtime arguments to your script (e. g. python myscript.py arguments et cetera, where "arguments et cetera" are the arguments), you can tap and hold the play button. This will bring up a popup window where you can enter the arguments you want to pass to the script.
If the book uses the shell for more things than that, you should do those parts on a real computer. There is StaSh, which is a shell written purely in Python for Pythonista. It is far from complete and only has basic features (plus a few things useful when working in Pythonista, such as a minimal git implementation) so you might not be able to run some of the shell commands from the book.
CCC. The graph looks fine now.
1. Why don't you use the 0:24 hours time axis, as the one I sent you and Is used by the Matlab-Octave script?
2. Where are those Faulty readings, Infinites?
3. Why don't you try to make intermittent recordings in a 24 hours periods and watch the result?.
As the App works like a noise Dosimeter, its purpose is to record the exposition to noise for a given time period during 24 hours, like at Job, when driving, at the disco, even while sleeping, -(maybe you snore and you are not aware)-so that it can be correlated with pulse, blood pressure, ECG and other biometric parameters.
If you give me an email address I'll send you another approach to graph plotting that I programmed with the basic interpreter. The graph plots can be zoomed in and out, stretched,expanded moved and rotated by simple finger gestures on the screen with a short code.Most of the source code is for the GUI.
I can not figure out the syntax for getting the x axis labels to go from 0 to 23.999.
Help if you can... https://github.com/cclauss/uncategorized_hacks/blob/master/SPLnFFT_Reader_numpy.py
count=24360082;
TabTime=[0:count/2-1]/(count/2)24;
This is the code of the Matlab-octave script related to Xaxis values. The graph that generates is for a full 24 hours recording, irrespective of the recording time for a given interval. If it's short, all values are so cluttered that the visual effect is of an aggregate of consecutive lines.
You can download the full script from the Facebook account of the author. If you have gnu.Octave try it an print the generated values if you have Microsoft Excel above 10, download Macro and analyze the code in Visual Basic.
I know all that you have written... My trouble is that I can't figure out the right matplotlib syntax.
In your last script when the data cleanse is set to False the App crashes. By the way, your former script with array and structure options read all 5.2 MB without problem. I think that the problem is related to the numpy library and the memory usage of float data type, since by default it uses only two 8 bytes
This version of your script works fine
#coding: utf-8
# cleanse
import numpy
data = numpy.fromfile('SPLnFFT_2015_07_23.bin', dtype=numpy.float32).reshape(-1, 2)
#data = data[numpy.all(data > 0, axis=1)] # cleanse
print(type(data), len(data)) # numpy.ndarray, 2786
print(data[:20]) # print first 20 fast, slow pairs
# HELP: A scatter plot is all wrong for this dataset
import matplotlib.pyplot as plt
fig = plt.figure()
ax = fig.add_subplot(1, 1, 1)
x = data[:,0]
y = data[:,1]
ax.scatter(x, y)
plt.title('SPLnFFT Noise data')
plt.show()
the problem with the matlab example is that it doesnt seem to have the right data size relative to the actual file structure.
if you know that the datafile always contains exactly 24 hours worth of samples, the numpy equivalent to the matlab is
t=numpy.linspace(0.0,24.0, N)
and of course you would not cleanse!
you would want the ability to zoom, however, which now requires a little more trickery, and probably you would only plot a given time range to keep the number of points down. while matlab can plot a million points, matplotlib on ios is strained!
I'm not quiet sure, but I think that what MATLB script makes is simple artihmetic;
Suppose that the file has a total 635 pairs of data points;
635 × 24 = 15240, hence
634 ÷ 15240 = 0.041601049869
Therfore the point intervals woul be = 0.041601049869 times 0,1,2,3,4,5,,..............635
After plotting the SLOW and FAST point values just need to put a label in the Time axis from 0 to 24 hours with one hour interval
Hope it helps
Thanks again JonB ... I am learning.
I updated the code to remove all the cleansing, add the zero hour to 24h x axis label as you suggested, and add elapsed_time(). The script takes about 2min 20sec to produce a full 24h day plot on my iPad.
I am still not satisfied with the x axis that currently starts at -5h (!) and ends at 30h with ticks every 5 hours. My goal is to have it start at 0h and ends at 24h with a tick every hour. My attempts to do so result in crashes so they are commented out.
There is yet another new release (v5.6) of the SPLnFFT app.
http://www.cirrusresearch.co.uk/blog/2013/01/noise-data-averaging-how-do-i-average-noise-measurements/
This link shows how to compute aggregated data (LEQ) from non-zero SPL values for a given time period
I sent an algorithm 2 hours ago to compute the X axis values for a full SPLnFTT binary file with no data cleansing I. Try it, but using the values that come in the MATLAB script. It should work. Regards
ManuelU, you need to be a little more specific as to what you want in the end. Do you want a single number(average SPL) over 24 hours... ? or plot of 24 hours where the resolution is dropped by, using a moving average, say dropping the resolution down to once per minute, or 10 minutes, and showing average and peak over that 10 minutes?
note that periods where spl is 0 will stay 0 after averaging!
or do you want the original resolution, but the ability to zoom the plot on each region where you actually have data?
or, detect how many recording sessions there were, and show N subplots, with only the data from that session, but showing the correct original timestamp in each subplot?
ccc. you want plt.xlim(0,24), and plt.xticks(numpy.arange(0,24))
JonB, In my program I have an option to process the whole data file in 1 hour or more chunks or even arbitrary chunks. The processing power for graphics is amazing. You just need to build up a pair of X,Y (SLOW-FAST) arrays and a few instructions to render a graphic output that response to finger gestures like any other professional graphic App for iOS.
A 24 hours overview is crucial to observe the segments that need to be analyzed in detail, for the search of pikes or a repeating pattern through time. By using this program and the SPLnFFT In an iPhone I detected some asymptomatic people with dangerous periods of sleep apnea, that otherwise couldn't have been detected. Many people work without any protection in noisy environments, like ambulance workers that are submitted to dangerous dB acoustic levels with the risk of permanent ear damage.
Respect to average values during a time period, the most common is the LEQ, that is a logarithmic average and you need to filter out zero values. That's easy done just by reading the array that hold the time values and SPL values for a given time period. For serious epidemiological investigation you need to sincronize with other biometric values.
My intention is to use a Holter-like ECG recorder. There are evidences of the relationship between noise and heart coronary disease, but few with the simultaneous recording of noise and ECG. To handle statistics I developed some years ago an App for the Mac OSX that uses Binary Logistic Regression and Survival analysis with parametric regression models for assessing the risk of diseases that might be related to noise. Statistics render numerical data, but sometimes I used the common sense instead of hypothesis contrast methods to take decisions. As you know, no hypothesis can be demonstrated; the most you obtain are only evidences. That can only be achieved with a team and the necessary tools.
One idea in mind is to analyze the noise data in the frequency domain with the FFT methods of the numpy library. This feature and the option to directly import the binary file from Dropbox was what made me chose Pythonista as a supporting App. Thanks for the valuable support from all people in this excellent Forum
The best way to learn about the basics of data processing with Pyhtonista for a new user is to read and try the excellent examples posted to this forum by CCC and JonB. The general Python documentation that come with the App is both obscure and almost sample-less
There are tons of cool examples to look at in Pythonista-Tools. I often consult @humberry's ui-tutorial when I am stumped with something in the ui module. Ole's gists also make for great reading.
CCC, Thanks a lot for this information. Do you know some good and extensive electronic book for KINDLE OR iBook about the Phyton language?. I bought two and became disappointed because of their poor content. Best regards
Hi JonB, Ccc,the last update works just fine. I process the total SPL file in chunks of one hour each. The code in standard basic is simple. Just create two vectors with the start and end times you want to process. Something like
for i=1 to 24
timeSTART(i) = (limit * (i - 1)) + 1
timeEND(i) = limit * i
I CREATE an input file and other output file AS BINARY where y save data filtered of NaN and infinite SPL values for further graphic processing. I use the FTPSERVER of Pythonista in one device and a FTP CLIENT in other remote device in the same Wifi local network. I use a FOR NEXT LOOP that goes from timeSTART(I) TO endSTART(I)
.Best regards
I can not really understand what you wrote. Perhaps edit your text above to put in a few blank lines to make it easier to understand. Your workflow is unclear to me. I think you want to create 24 binary files, one for each hour in the day. You want to filter out the NaN and INF values. You want ftp them from one iOS device to another iOS device. Is there something else that you need? What is the "ask"?
@JonB did create a fast, pinchable matplotlib view https://forum.omz-software.com/topic/2007/matplotlib-pinch-pan-dynamic-view but you need the current Beta version of Pythonista to run it. I don't quite understand it all myself but it is quite cool.
SPLnFFT_hourly_split.py takes about 0.3 seconds to read in 1,382,400 float32 values and write them back out to 24 binary files that each contain 57,600 float32 values that represent one hour of that day.
With the former BASIC code I only generate the starting and ending data points for a given time interval. Suppose you observe the relevant data is in the time interval that goes from 8 to 14 hours. Then your loop would go from start(8) to end(14). I only save one binary file for that interval to compute aggregated data and graphics, that look Iess cluttered in a shorter interval tha in a full 24 graph plot.
I wish I knew how to send images to the forum, so you would appreciate differences in quality. "limit" is an integer variable of the 57600 data points per hour. Here are the values for 1 to 8 hours, startling in the left and end time in the right
1 55760
55761 111520
111521 167280
167281 223040
223041 278800
278801 334560
334561 390320
390321 446080
The numbers at the end of your post are not correct. The correct (zero-based) numbers are generated by:
floats_per_file = 1382400 / 24
print('{} floats per file'.format(floats_per_file)) # 55760
for i in xrange(24):
print(i*floats_per_file, (i+1)*floats_per_file - 1)
This code is similar to the code in SPLnFFT_hourly_split.py. Python's span syntax my_list[start_index : end_index] means that we do not need to loop over all elements but instead can just directly grab a block of data elements (such as an hour's worth of data) in a single operation. This helps to explain how we can break one binary file of 1m+ floats into 24 binary files in 1/3 of a second.
How did you know that 08h00 to 14h00 were the hours of interest?
Is there a mathematical test that I could run to determine which hours have useful data and which do not? Or must this decision be made by a human looking at a graph of the full day. Numpy supports a dizzying number of operations that can be applied to a ndarray if you can tell me what to look for. Alternatively, a human can tell the program which hours (minutes, seconds) are of interest and the file can be divided that way and rewritten as a smaller binary file.
The way to post an image to the forum is to put the image on an accessible web page (GitHub, Dropbox, etc.) and then add ?raw=1 to the end of the publicly accessible URL. Like .
When you save raw data from th SPLnFFT app, you can save a 24 hours plot as well. You see the chunks of data as vertical cluttered lines, no vallies at all. This graph can be used as a hint about what time interval deserves to be analyzed in detail. The arrays are one based. Thanks for the info about sending images through the forum. I'll try it.
Regards.
By the way the time used for loading, saving and processing data is about 2 minutes per hour. I have a 10 MB Wifi, but a fiber 300 MB is coming.
OK. So there could be a Pythonista UI where the user would specify a start time and an end time. The script could use those times to determine which exactly which floats to copy from the original, full size binary file to the new, smaller binary file. Is that what you want? Do you want the Matplotlib graph too? Is start hour and end hour good enough or would you want to be able to specify minutes too?
I am still unclear why you transfer the files from one iOS device to another iOS device on the local WiFi network. Why not just do all the data capture and visualization on the first iOS device. The speed of the local WiFi network will not be improved by your move to fiber. Unless a new WiFi hub is included in the fiber upgrade.
Please try this. I hope I understood your instructions
https://www.dropbox.com/s/00e5iyfealnuzxs/spl_graphplot_test1.png?raw=1
It didn't work out. It gives a 404 error message. I wonder if I should save in a specific folder in Dropbox.
Respect to your question, it's simple. The Pythonista interpreter is the only App that can import from Dropbox the Binary Files saved by the SPLnFFT App. To avoid the obsolete iTunes File Sharing, that needs a desktop computer, cable conextions, etc., I use your FTP server to upload the files from the Pythonista''s sandbox to my BASIC interpreter sandbox. I'm pretty stone-headed and y don't understand why Apple don't allow the easiest way as the Open in ... Option available in other programs.
What is the name of the Basic Interpreter app that you use?
TechBASIC
SPLnFFT_strip.py removes any hours which only contain (0, 0) values from the start and end of a SPLnFFT.bin file. Much like ' 1 2 3 '.strip() returns '1 2 3'. It finds the first hour that has sound and the last hour that has sound and writes a new file that only has the data between those hours. This will result in smaller file sizes which should reduce the FTP transfer time and provide more focused plots/graphs.
OPEN "test_tr.bin" FOR OUTPUT AS #2
REM BEGIN THE FOR - NEXT LOOP TO READ HOUR CHUNKS
count = 1
startm = timeSTART(1)
endtm = timeEND(1)
PRINT "START DATA POINT "startm
PRINT "END DATA POINT "endtm
REM LOOPS UNTIL THE START DATAPOINT IS FOUND. NO WAY TO ACCESS THERE DIRECTLY
FOR k = 1 to endtm
GET #1,,a
IF k < startm THEN
GOTO 200 REM LOOP
END IF
REM ***LOOK FOR INFINITE AN NAN SPL VALUES
isinf# = a
isnan# = a
i = math.isInf(isinf#)
j = math.IsNaN(isnan#)
IF (i <> 0) OR (j = 1) THEN
PUT #2,,v REM dB VALUE*v = 33.33333 WHEN NAN OR INFINITES ARE DETECTED
badspl = badspl + 1
GOTO 100
This is the BASIC code I use To clean up NAN and Infinites. This prevents you, if you clean up in block, to change the order of SLOW and FAST values when you read data in one column and then you transform to a 2D matrix
In en second time and before transforming the sequential values to a 2D matrix I look for the flag value 33.333333 and replace it with the logarithm average of the preceding 10 SPL values if n > 10 or the next when n is <= 10
Did you run SPLnFFT_strip.py? Does that do something useful for you or not?
Do you still get INFs and NaNs in files generated by the current SPLnFFT app? Can you please add an INF_counter and a NaN_counter to your basic program and tell me how many of each that you are seeing in files generated by the current SPLnFFT app?
Do you have the beta?
i created SPLView which is an interactive plot for this data.
https://github.com/jsbain/objc_hacks.git
In order to handle the problems with a million points in a plot, the data is resampled, so that there are only ever 500 points in a plot. When zoomed way out, each point of the fast represents the peak of the fast signal over about ~3 minutes, while the slow is resampled using a log average (this seems appropriate for what you are doing, since i think you are interested in how far the fast peaks are above slow average).
As you zoom, the data is continually resampled, to always keep 500 points onscreen, meaning as you zoom, each point starts represnting less and less time. This way, you can first find interesting peaks from the wide view, then zoom to an area of interest, and eventually get the full resolution data.
The code that does the resample is
here.
If you dont have the beta, let me know, it would be easy to convert the touch handling to a non-beta interface.
SPL DATA START READING AT 19:14:53 CEST
START DATA POINT 1
END DATA POINT 55760
NaN
SPL DATA ENDED READING AT19:18:27 CEST
TOTAL CHUNK LENGTH 2788
SOURCE FILE LENGTH 5306560
VALID DATA SAVED IN THE SANDBOX : 5576
BAD VALUES (NAN OR INFINITE) DETECTED : 1
FILE LOAD ENDED AT 19:18:27 CEST
This is the output OF a SPLNFFT FILE analyzed with my program . The wifi speed was AT THIS TIME OF 5.8 MB
Did you run SPLnFFT_strip.py? Does that do something useful for you or not?
Not yet, but of course is useful to process SPL data in the Pytonista enviroment. I'll try it with a full 24 record of a MD that works transporting critical patients in an Ambulance. I sent him the SPLnFFT App. The record will be done with an iPhone 6. I'll send you the results when they are available. Another practical application is to monitor at bed time people that snores since they're prone to sleep apnea that may be dangerous for health. The measures of the app are accurate and render the same SPL values of that registered with a professional class 2 SPL meter that I use to calibrate it. By the way there are a free sample for evaluation of techBasic, the techSampler. There you can observe how easy is to plot high quality graphics with pinch gestures.
JonB, If you're talking about a new beta update of phytonista the answer is no. If is about the template to compile the scripts into a stand alone app with Xcode, the answer is yes; I downloaded yesterday the Zip file that will be installed in a Mac mini with Yosemite when I solve the problem of repeated phishing attempts that my antivirus blocks. It seems it's related to the Apple Store ID . I also have read the code for resampling the SPLnFFT data to plot graphics with pinch gestures. Since I'm a beginner in Phytonista, It's complicated for me to understand how you link the SPLnFFT data file to this script.
CCC, this is going to make you happy. This is the processing time of a 15 hours continuos recording with SPLnWATCH, a child App of SPLnFFT. It records in the background with a minimal battery usage (about 13%)
Elapsed time (3 Starting scatter...): 0:00:01.277414
Elapsed time (2 Scatter): 0:00:19.745673
Elapsed time (1 Adornments): 0:00:19.818221
Elapsed time (0 plt.show() Done.): 0:02:09.151619
The graph output is nice an fit well to the recording tines. I wish I new how to send it to you because I'll try to make it with your latest option by hours chunks.
CONGRATULATIONS FOR YOUR GREAT SCRIPT.
I wish I [k]new how to send it to you
If you have a free login to GitHub, you should be able to go to https://github.com/cclauss/SPLnFFT_tools and click the "+" to add a new file to the repository. Provide a reasonable name with the proper extension (.png, .jpg, etc.). You will then have to click the "Propose new file" and then "Create pull request" button a few times.

I made a screenshot and sent the image to the Twitter account @olemoritz to send it to you. Do you have a Twitter account?. It's simpler for me

This is the image that I got from @ManuelU via Twitter.
It shows why we want to preprocess our SPLnFTT.bin data files with SPLnFFT_strip.py. The hours from 14h thru 24h contain all zeros. That script would remove those null hours which would
1. decrease file size
2. reduce upload time, and
3. give us higher resolution plots.
And here is a plot from his TechBasic program:

@ManuelU, I created a new repo https://github.com/cclauss/SPLnFFT_tools for the code from this thread and updated the links above to point to that repo. I have also included a new binary file of me snoring. Please tell me what the threshold of danger is for snoring. My wife assures me that I am way over that limit but it would be good to get a second opinion.
Do I understand SPLnWATCH correctly? Is that an AppleWatch app that records noise levels? If so, we could get @Phuket2 to use it to tell us which of his favorite bars has the most impressive Sound Pressure Levels.
@ccc , LOL, yes I will be the data collector for the bars. Some poor soul like me has to do it :) I also have netatmo (inside, outside and rain module) but the last time I looked I thought there was no python API. I also have Phillips Hue lights. I have seen there are modules to interact with the hue lights API (I think on the tools site). But could be funny to have your snoring levels controlling the lights :)
Hi. It depends on frequecy during the whole sleep time, the apnea periodos and the background medical context for each person. Right now I don't know what are the critical values for both parameters. I'll make a peer view on the topic in Internet and I'll.send to you the best links. Key words would be: sleep apnea etiology clinics ,diagnostic and treatment. I record noise with the iPad version of SPLnWATC I, think it's universal, but you need to adjust the settings in the mother App, SPLnFFT. I use the watch version because can record in the background, which supposes a battery and screen saver. You haw to buy the 24 hours record option and have a Dropbox account. that's all. Hope it helps
@Phuket2 Netatmo https://github.com/philippelt/netatmo-api-python
@ccc , thanks. Is great to have. In itself, not Exciting (the dashboard app is great), but combined with hue lights could be a lot of fun. I know if than then, but it's just too slow to have real time fun :)
here is a slightly different take (on the original wuestion:dynamic matplotlibs). this one is written so it should be compatible with 1.5, as it uses plain touch handling.
the approach i took was as follows: there are zoomable scrollbars in top and size, which van be pinched or scrolled. the width of the bar represents the fraction of a day on the screen. i dont have the skeomorphism tuned quite right, it is slightly awkward i admit. finer panning can be achieved by pulling finger down away from the bar while dragging, similar to the way videos work in safari.
after computing the zoom limits, the way i deal with the millions of points is to resample down to just a few hundred points on the scren... which after all is about all you can see anyway given fixed resolution of the device. i do that by calculating how many of the original data points lie within each resampled point, and then compute the peak signal (for the fast data) and log average (for the slow), then only plot those points. in addition, setting the dpi for the matplotlib image low during dragging makes this reasonably responsive.
One thing i learned... ui.in_background is not the same as as threading.Thread... the former seems to queue up commands all on a single background thread, rather than creating a new thread each time. hence the run_async decorator which i copied from SO.
see ZoomSlider and SPLView11 at
https://github.com/jsbain/uicomponents
Next TODO would be to add single touch data "cursor" inside the plot.
@ManuelU, generating new hourly files with this new version of SPLnFFT_hourly_split.py should allow you to plot them again.
@ccc I noticed now that iTunes File Sharing is not supported even when you connect your iOS device with a cable to a desktop computer
@ManuelU this was changed in Build 160025. From the release notes:
iTunes File Sharing is no longer enabled (this was temporary anyway, but with the new internal directory structure, it wouldn't actually work anymore)
@webmaster is there an Android or desktop version of Phytonista?
@ManuelU Yes, it's called Python. ;) Of course Pythonista comes with some third-party modules (like numpy and matplotlib) that are not part of the Python standard library, those need to be installed separately. You can do that using the pip command (pip install numpy), or by installing a Python distribution like Anaconda that includes many third-party libraries. Pythonista-specific modules like ui are of course not available on normal computers.
@CCC the rule of thumb I use to assess if SLOW and FAST SPL VALUES have not been swapped in the cleansing process is that the start time should always be an *odd number and the end time should always be an even number*. I noticed that it could happen when reviewing a file that started with a NAN and when eliminated the next register, a fast measurement , was taken as a slow measurement. This may happen if you read the values in a 1D vector and then you transform in a 2D matrix
@ManuelU When you say even and odd, are you talking about zero-based numbering like Python or one-based numbering like TechBasic? If zero-based then the very first element in the binary file is even. If one-based then the very first element in the binary file is odd. Thus the Python programmer and the TechBasic will not agree about even and odd.
My current code does not reverse the slow and fast values and it does not detect Infs and NaNs and does no data cleansing.
The code reads in slow,fast pairs into one long two column array. It the writes the first 1/24 th of that array into the 00h_to_01h.bin file (0h00 to 0h59). It writes the second 1/24th of that array into the 01h_to_02h.bin file (1h00 to 1h59).
If you would like the code to do something different, please open an issue and I will see what I can do.
@ccc it's one based arrays. If Python is zero based then is right and your script works fine and at an incredible speed for an interpreter.
I just call your attention on this line of code of your script that is not flagged : t_bad=t[(fast<=0) | (slow <= 0)]. As far as I know, negative SPL readings arise when infinites values are recorded and could happen if you have a telephone call in your iPhone while running the App. I only use iPad with no cellular. It seems that in the latest versions of both Apps this bug has been corrected, but I follow the general principle that no programm is bugless. Thank a lot for you nice attention and your work on this topic.
@dgelessus I downloaded and installed Python Anaconda on my Mac mini OSX Yosemite with no problems, but I don't know where to place my SPLnFFT.bin files to acces them from the @ CCC scripts or where are stored the .py script files. It has a nice and colorful GUI, a good surprise for me, because I thought that it only run with console commands. Thanks in advance for your help and advices.
import os
print(os.path.abspath(os.curdir))
@CCC the FTP SERVER script work well between iOS devices. I tried to connect from my Mac mini with the "Go -> Connect to Server..." menu item from the Finder using all the possible combinatios from the Connect Window, but there is no way to connect . What I'm doing wrong?. Both devices are in the same local Wifi network.
I use Dropbox to move files from iOS to Mac. Is that a possibility for you?
@CCC, yes I transferred that way so far , but I learned from the forum that you can transfer all the files stored in the Phytonista sandbox with the FTP Transfer script running in your iOS device and the Connect to Server item from the Mac OS X Finder. The trick is that you have tu use the IP Address insted of the name of your iOS device.and connect by pressing the Guest button in the Mac. You don't need to put the username and password when you transfer between iOS devices